Using The TeSSLa Playground
The TeSSLa playground is available online and is intended for an easy and exploratory usage of the TeSSLa compiler and interpreter. You can simply enter and modify a TeSSLa specification and an input trace in the web IDE and you can immediately inspect the processed output trace. The TeSSLa Visualizer helps you to quickly get an overview on the nature of a TeSSLa trace.
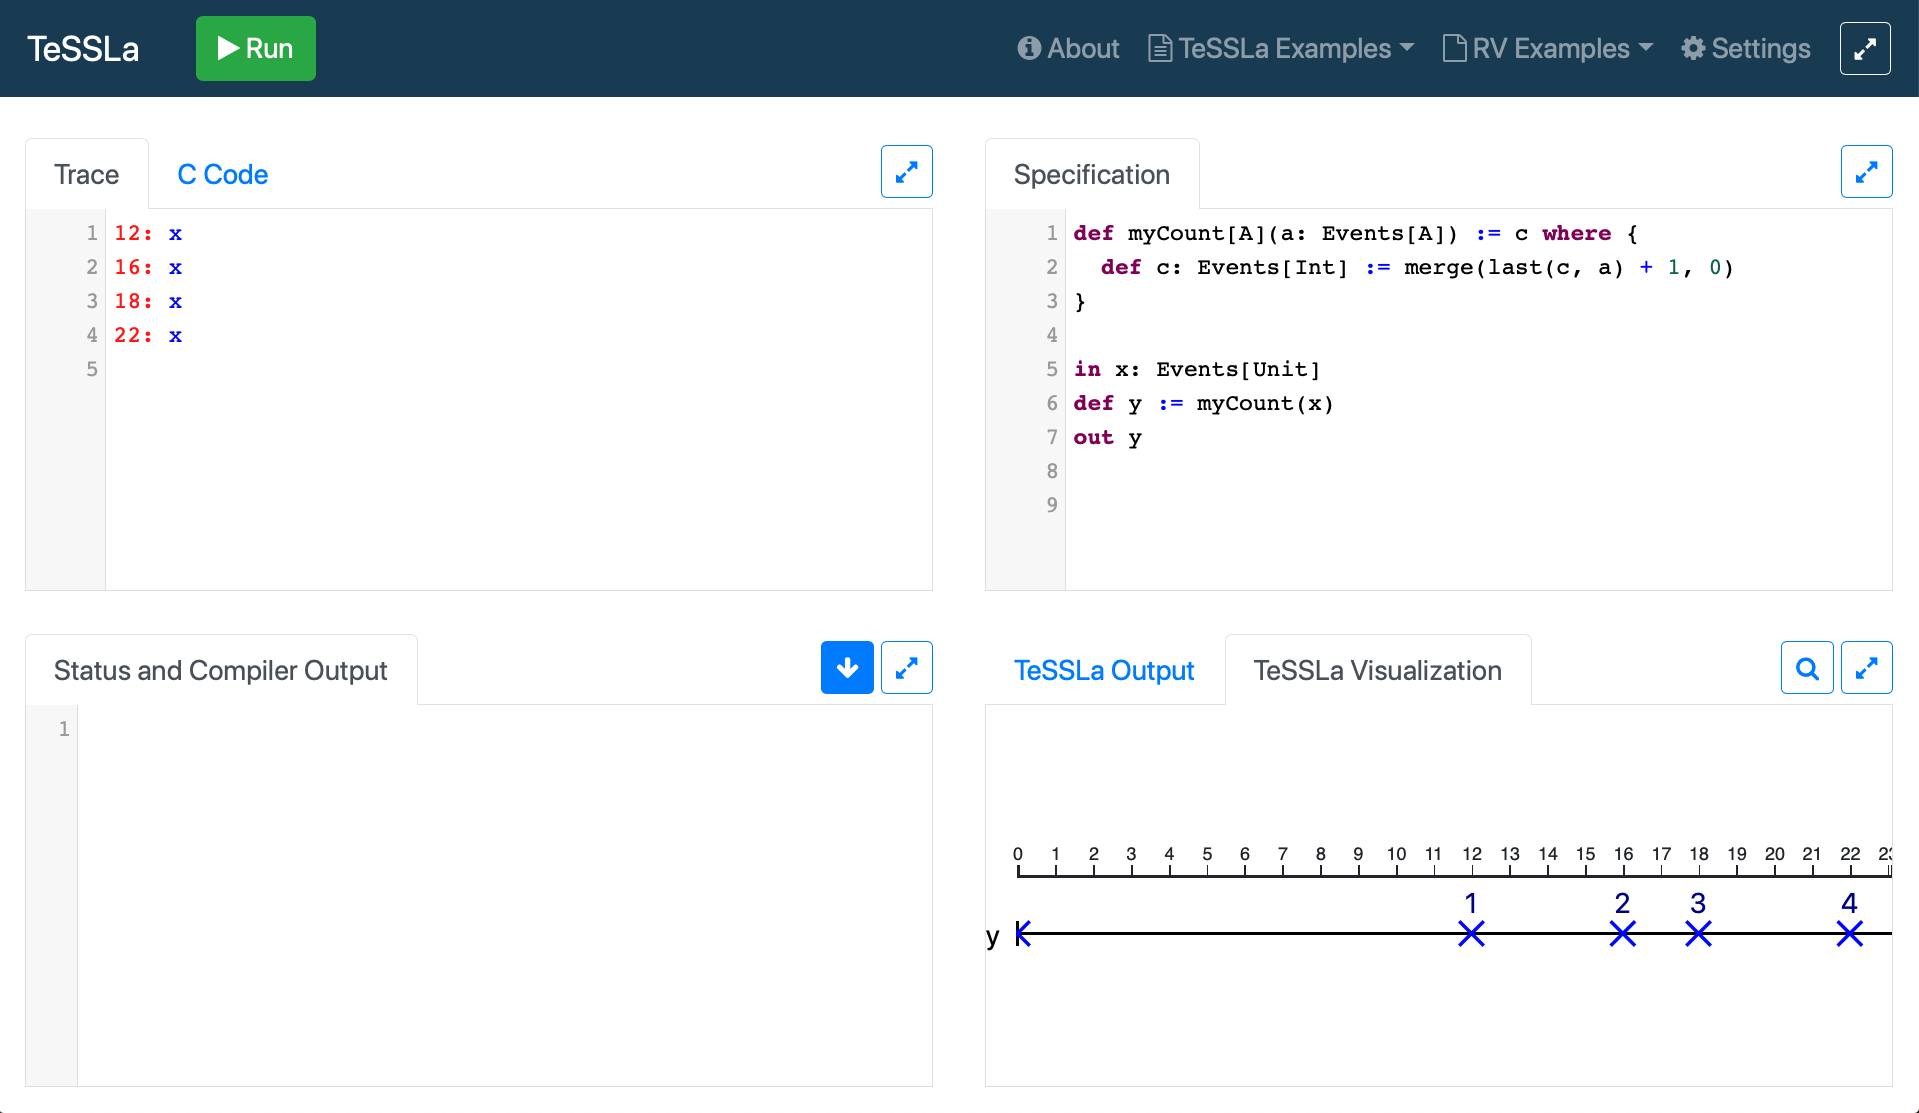
The TeSSLa Playground is available online at https://play.tessla.io/ The web IDE consists of four text editors:
- The Trace editor in the upper left contains the input trace. You can switch to C Code in order to generate input events from executing an instrumented binary, but we will stick to a given input trace for this part of the tutorial.
- The Specification editor in the upper right contains the specification.
- The Status and Compiler Output view in the lower left contains compilation and runtime errors if any occurred.
- The TeSSLa Output log in the lower right shows the output trace.
Press the green Run button in the title bar to execute TeSSLa. Notice the output trace in the lower right. Try clicking on TeSSLa Visualization to get a visual representation of the output trace instead.
Navigating Inside the Visualization
In the normal mode you can zoom using your mouse wheel or your mouse's zoom gesture. You can click and drag to move the zoomed visualization. Note that your mouse cursor must be over the trace diagram for this to work. Booth zooming and panning are only supported horizontally. In order to zoom the entire picture you can use your brothers zoom features.
You can click on the magnification glass icon in the upper right corner of the visualization to switch into the zoom mode. Now you can select a region of the trace by clicking and dragging. The selected region will then be zoomed. You can still zoom in and out with the mouse wheel or your mouse's zoom gesture.
You can click on the TeSSLa Visualization to reset the visualization.
Click on the icon with the arrows in the upper right corner of the visualization in order to enable the full screen mode which hides the other tabs and only show the visualization.
Configuring the Visualization
The visualization can be configured with the TeSSLa specification in the Specification tab in the upper right corner of the web IDE. For the visualizer the specification itself is ignored, but the out statements are important:
- The order of the out statements controls the order of the streams in the visualizer.
- The visualization annotations before the out statement can be used to set the style of the visualization for that stream.
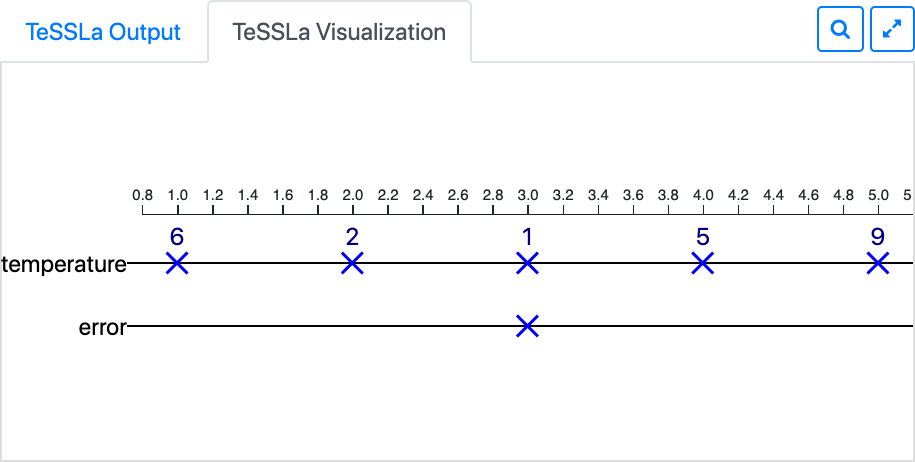
So for example the following specification can be used to adjust the style of the visualization of the example trace mentioned above:
@VisDots
out temperature
@VisUnitEvents
out error
Click on the tab TeSSLa Visualization to update the visualization according to your configuration.
Available Styles
See the section on Visualization Annotations in the documentation of the standard library to learn more about the available styles. The following diagram shows the different styles for the example trace of the temperature stream mentioned above:
stream Events: events
stream UnitEvents: unit events
stream Bubbles: bubbles
stream Dots: dots
stream Graph: graph
stream SlimGraph: slim graph
stream Plot: plot
stream SlimPlot: slim plot
stream Signal: signal
stream Bool: bool
---
1: Events = 6
1: UnitEvents = 6
1: Bubbles = 6
1: Dots = 6
1: Graph = 6
1: SlimGraph = 6
1: Plot = 6
1: SlimPlot = 6
1: Signal = 6
1: Bool = false
2: Events = 2
2: UnitEvents = 2
2: Bubbles = 2
2: Dots = 2
2: Graph = 2
2: SlimGraph = 2
2: Plot = 2
2: SlimPlot = 2
2: Signal = 2
3: Events = 1
3: UnitEvents = 1
3: Bubbles = 1
3: Dots = 1
3: Graph = 1
3: SlimGraph = 1
3: Plot = 1
3: SlimPlot = 1
3: Signal = 1
3: Bool = true
4: Events = 5
4: UnitEvents = 5
4: Bubbles = 5
4: Dots = 5
4: Graph = 5
4: SlimGraph = 5
4: Plot = 5
4: SlimPlot = 5
4: Signal = 5
4: Bool = false
5: Events = 9
5: UnitEvents = 9
5: Bubbles = 9
5: Dots = 9
5: Graph = 9
5: SlimGraph = 9
5: Plot = 9
5: SlimPlot = 9
5: Signal = 9
5: Bool = true
The color of the events is defined by the event's value. Normal events are always depicted in blue. Boolean events are depicted in green for true and red for false.
Using the Visualizer With a Given Trace
Let's assume that you generated a trace in the TeSSLa trace format for example the following trace:
1: temperature = 6
2: temperature = 2
3: temperature = 1
3: error
4: temperature = 5
5: temperature = 9
You can copy this trace into the TeSSLa Output tab in the lower right corner of the TeSSLa web IDE.
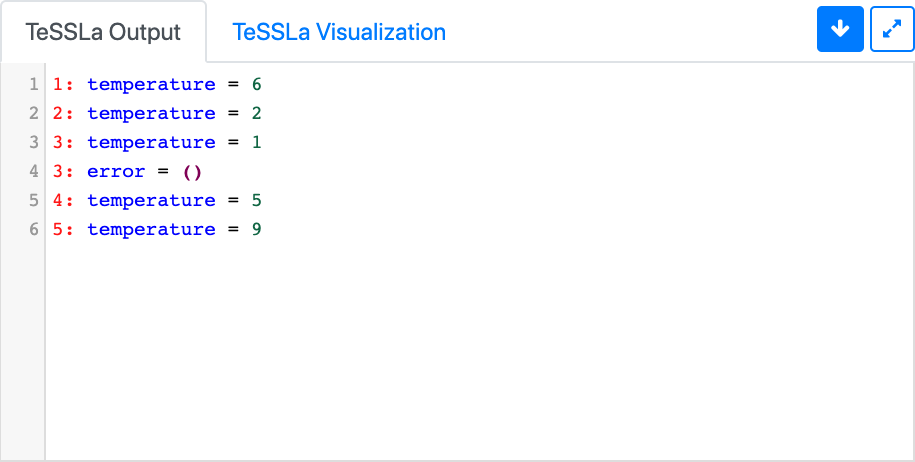
If you now switch back to the visualizer you see a visualization of this trace.