TeSSLa Telegraf Connector
In an effective Runtime Verification process it is crucial that the monitoring unit can easily be interconnected towith the data sources of interest and storage or visualization units for the monitoring results. TeSSLa's Telegraf connector allows a comfortable integration of the Telegraf framework with TeSSLa
In this article, we will exemplary describe how to measure, process, store, and visualize CPU loads using TeSSLa with Telegraf integration, InfluxDB and Grafana.
Telegraf is an open source agent to collect and report metrics and data from various sources such as servers, databases or IoT devices. It is commonly used in combination with InfluxDB. Telegraf comes with many plugins, including the CPU-plugin which reads usage data from the processor and sends it as measurements into Telegraf. InfluxDB is a time series database. It is designed for handling time-stamped data, such as events, measurements or logs. For visualization, we will use Grafana, which retrieves information from a database using SQL queries and displays it on a web-based frontend.
Setups like these are very common and many tutorials for them can be found on the internet. In our example however, we will be using TeSSLa (Temporal Stream-based Specification Language) to analyse and process the data received from the cpu-plugin rather than just logging it.
In our setup, we will be using TeSSLa to check if the CPU-usage exceeds a specific value, which in our case is 50%.
To be able to use TeSSLa in a Telegraf Environment, we use the TeSSLa-Telegraf-Connector. This connector reads data from Telegraf and sends them to a TeSSLa monitor, where the data is processed and output events are generated. Finally, these output events are sent back to Telegraf.
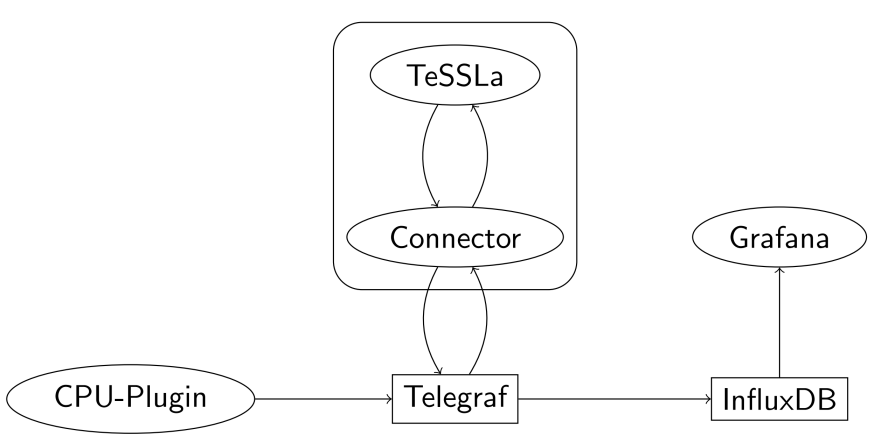
The diagram below illustrates the data flow between the various components involved in our setup. The CPU plugin measures values like CPU utilization and transmits them to Telegraf. Telegraf then distributes the measurement values to all connected components, including the TeSSLa-Telegraf-Connector, the InfluxDB, and the CPU plugin itself. The CPU plugin ignores these incoming messages, and we will now focus on the other parts of the diagram.
The communication between Telegraf and the TeSSLa-Telegraf-Connector is established via UDP (note that this requires that the TeSSLa monitor has enough calculation power, such that no packages are lost). The incoming messages are interpreted and forwarded to the TeSSLa Monitor, which outputs a stream with a value of 1 if the CPU utilization is higher than 50%, and a value of 0 otherwise. The output stream events are read by the TeSSLa-Telegraf Connector and sent back to Telegraf.
The Influx database receives all incoming measurement values from both the CPU plugin and the TeSSLa Monitor, and stores them. Grafana periodically queries these stored measurement values from the database and visualizes them on a web interface.
The source and more information about the project can be found on the project page.
How does it work
In the first step, the implementation uses the TeSSLa compiler to analyze the in- and output streams and their annotations. After that, the TeSSLa compiler generates a Rust project that implements the same behavior as the TeSSLa specification.
The last step realizes the communication between the generated Rust project and Telegraf. For this, a Rust program is generated that connects to Telegraf via UDP. Incoming data points from Telegraf are interpreted and based on the information we get from that, the input functions of the TeSSLa monitor are called. Incoming events from the TeSSLa monitor are translated into the InfluxDB format and sent to Telegraf via UDP.
Step-By-Step Example
0. Prerequisites
We expect that the following things are already installed on the system:
- A Java runtime environment, which is accessible by the $PATH environmetal variable
- A Rust Compiler. The cargo command must also be accessible by the $PATH environmetal variable
- Telegraf itself
We deliver a executable file for AMD64 based linux machines. If you want to use our implementation on a different system, you can compile and use our implementation on any system that supports Java, Rust, Telegraf and dotnet.
1. Downloading the executable of our implementation
Visit https://git.tessla.io/telegraf/tessla-telegraf-connector and download the Release/tessla-telegraf-connector.zip file from the Release folder. Unzip it to any place you like.
2. Writing a suitable TeSSLa Specification
First, we include the Telegraf library.
include "<path>/Telegraf.tessla"
From TeSSLa version 2.1.0 on also
include lib "telegraf:1.0.0"
is possible. If the library is not yet available it is downloaded automatically and included with this command.
Next, we define our input stream to check the total CPU usage of the system using the cpu plugin for Telegraf. We will be using the usage_idle values and subtract them from 100 to get the overall cpu usage. For the automatic connection of this input stream to the CPU plugin via Telegraf we make use of the TelegrafIn annotation. The first parameter defines the measurement, the second is a list of tags, and the third is the field name."
In the following snippet, <system_name> must be replaced by the system name that will be running Telegraf.
@TelegrafIn("cpu","cpu=cpu-total,host=<system_name>", "usage_idle")
in cpu_usage_idle: Events[Float]

def totalCpuUsage: Events[Float] = 100.0 -. cpu_usage_idle
We define a stream, that has the value 1, if the total cpu usage of the system is above 50% and 0 in any other case. We could be using booleans for this, but because we want to visualize the stream using Grafana. Since changing datatypes in TeSSLa is much easier than in Grafana, we chose to do it this way.
def totalCpuUsageLimit: Events[Float] = if (totalCpuUsage >. 50.0) then 1.0 else 0.0
The last step in the TeSSLa Specification is to define the output stream, that is returned into Telegraf. We can use the TelegrafOut annotation for that. The parameter of that annotation defines the the measurement name.
@TelegrafOut("cpulimit_usage_system")
out totalCpuUsageLimit
The TeSSLa file as a whole looks like this:
include "<path>/Telegraf.tessla"

@TelegrafIn("cpu","cpu=cpu-total,host=<system_name>", "usage_idle")
in cpu_usage_idle: Events[Float]

def totalCpuUsage: Events[Float] = 100.0 -. cpu_usage_idle

def totalCpuUsageLimit: Events[Float] = if (totalCpuUsage >. 50.0) then 1.0 else 0.0

@TelegrafOut("cpulimit_usage_system")
out totalCpuUsageLimit
3. Installing Grafana
Installing the latest Grafana panel on Ubuntu is as easy as running the following commands:
sudo apt-get install -y apt-transport-https
sudo apt-get install -y software-properties-common wget
sudo wget -q -O /usr/share/keyrings/grafana.key https://apt.grafana.com/gpg.key
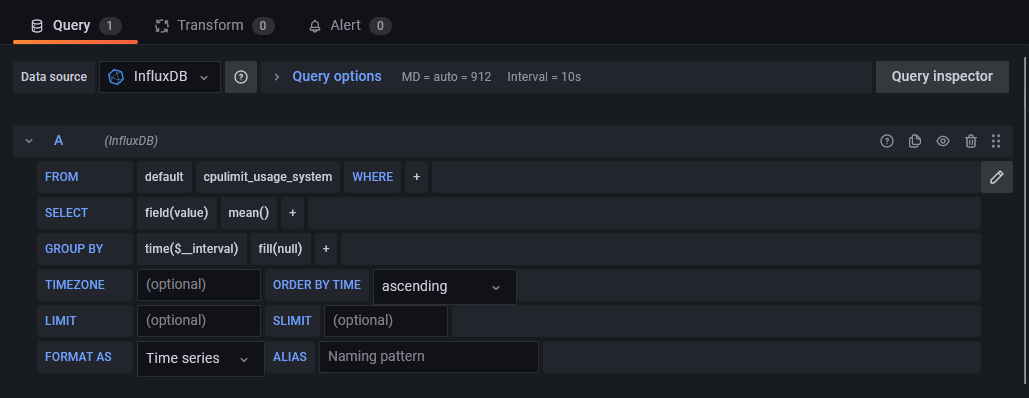
Once installed, we are able to get right into the panel and can start creating some graphs. We use the following Grafana query to visualise the CPU High Limit Usage (defined in our TeSSLa Specification as >50% utilization) for the system, user and guest.
4. Installing InfluxDB
Installing InfluxDB is also a breeze. In our example we install the v1.8 InfluxDB using the following commands:
wget -q https://repos.influxdata.com/influxdata-archive_compat.key
echo '393e8779c89ac8d958f81f942f9ad7fb82a25e133faddaf92e15b16e6ac9ce4c influxdata-archive_compat.key' | sha256sum -c && cat influxdata-archive_compat.key | gpg --dearmor | sudo tee /etc/apt/trusted.gpg.d/influxdata-archive_compat.gpg > /dev/null
echo 'deb [signed-by=/etc/apt/trusted.gpg.d/influxdata-archive_compat.gpg] https://repos.influxdata.com/debian stable main' | sudo tee /etc/apt/sources.list.d/influxdata.list
We then create a new database using the influx shell:
CREATE DATABASE tesslaTelegraf
Followed by a database specific user with sufficient permissions:
CREATE USER tesslaUser WITH PASSWORD 'OURPASSWORD'
GRANT ALL ON tesslaTelegraf TO tesslaUser
5. Adapations to the Telegraf Configuration
Some adaptions to the Telegraf configuration are required to make our setup work:
1. CPU-Plugin
Since we expect to get cpu usage data from Telegraf, we need to activate the CPU-plugin in Telegraf. Therefore we add the following lines to the telegraf.conf file:
[[inputs.cpu]]
    percpu = true
    totalcpu = true
    collect_cpu_time = false
    report_active = false
2. InfluxDB
We want to store all measurements and events in the database. We can do this by adding these lines to the Telegraf configuration:
# Forward cpu data into influxdb
[[outputs.influxdb]]
  urls = ["http://localhost:8086"]
  database = "<Database_Name>"
  username = "<InfluxDB_User>"
  password = "<InfluxDB_Passw>"
3. TeSSLa-Telegraf-Connector
The adjustments to the telegraf configuration required for the TeSSLa-Telegraf-Connector can be automated by the TeSSLa-Telegraf-Connector itself. We will show how to do this in the next section. But first, let's take a look at what adjustments are made, or how one can make these changes by hand.
The tool makes two changes to the configuration. An input and an output plugin are defined, which reads and writes measurement values in InfluxDB format via UPD. It is assumed that the TeSSLa-Telegraf-Connector runs on the same machine as Telegraf, using port 1653 for input and port 1654 for output.
If automated configuration adjustments are not desired or permitted, the TeSSLa-Telegraf-Connector must be run with sudo for this. These changes can also be made manually by adding the following entries to the configuration file.
[[outputs.influxdb]]
    ## Output to Tessla Plugin
    urls = ["udp://127.0.0.1:1653"]
and
[[inputs.socket_listener]]
    # input from Tessla Plugin
    service_address = "udp://:1654"
    data_format = "influx"
4. Compile and start
The final execution of the whole toolchain requires the following command to be run:
[sudo] <pathToRunnable>TesslaTelegrafConnector -i <pathToTesslaFile> -o ./outputFolder -c /etc/telegraf/telegraf.conf -r
- The -i argument defines the TeSSLa-Monitor.
- The -o argument gives the path, to which temporary files are written. You can use any writable path here.
- The -c /etc/telegraf/telegraf.conf argument is optional and gives the path to the Telegraf configuration file. This argument is optional and only required, if configuration should be updated automatically. If your are using the standard directory for the configuration file, you need to run the entire command as sudo.
- The -r argument defines, that the TeSSLa-Telegraf-Connector and the TeSSLa monitor are started directly. Without it, the program stops after generating the temporary files. The connector itself must be started manually then.
The command given above compiles the TeSSLa specification and starts it in combination with the TeSSLa-Telegraf-Connector. Additionally, the Telegraf configuration is modified for the needs of the connector. The last step to do is to (re)start Telegraf. How you do this depends on your system and the form of your Telegraf installation. The standard case on a common Linux system would be to restart the Telegraf-Service by calling
systemctl restart telegraf
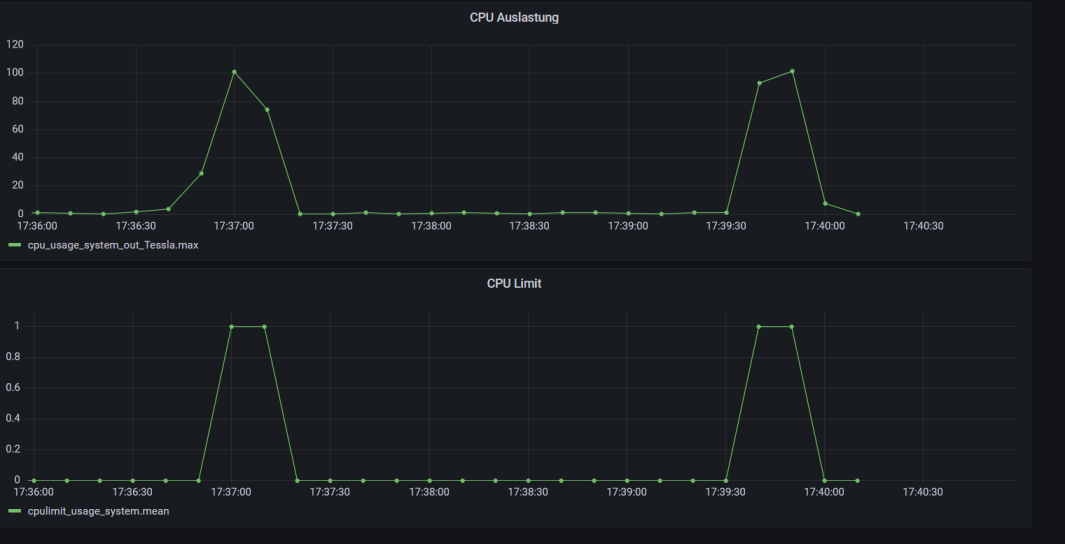
5 Visualization
The result of the monitoring can finally be seen in the Grafana application. You can see the peak in the CPU-Usage on the top and the output of the TeSSLa program on the bottom.